Monitoring & Alerting
📌 1. What This Page Covers
This page explains how to enable OpenIM monitoring and alerting in a quick-deployment setup and complete the initial Grafana dashboard configuration.
After finishing this page, you will be able to:
- start
Prometheus,Alertmanager,Grafana, andnode-exporter - sign in to
Grafana - import the main
OpenIMmetrics dashboard - import the
node-exporterhost monitoring dashboard
📌 2. Start Monitoring
1. Start Components
The monitoring and alerting components used by OpenIM are prometheus, alertmanager, grafana, and node_exporter.
When you start components with docker compose up -d, the monitoring components are not started by default. To start the monitoring components, use:
docker compose --profile m up -d
Note: This approach does not apply to Windows systems. If you need to enable the monitoring components on Windows, you must modify the network mode of the monitoring services in
docker-compose.yml, map the corresponding ports, and then replace127.0.0.1inprometheus.ymlwith the internal IP address.
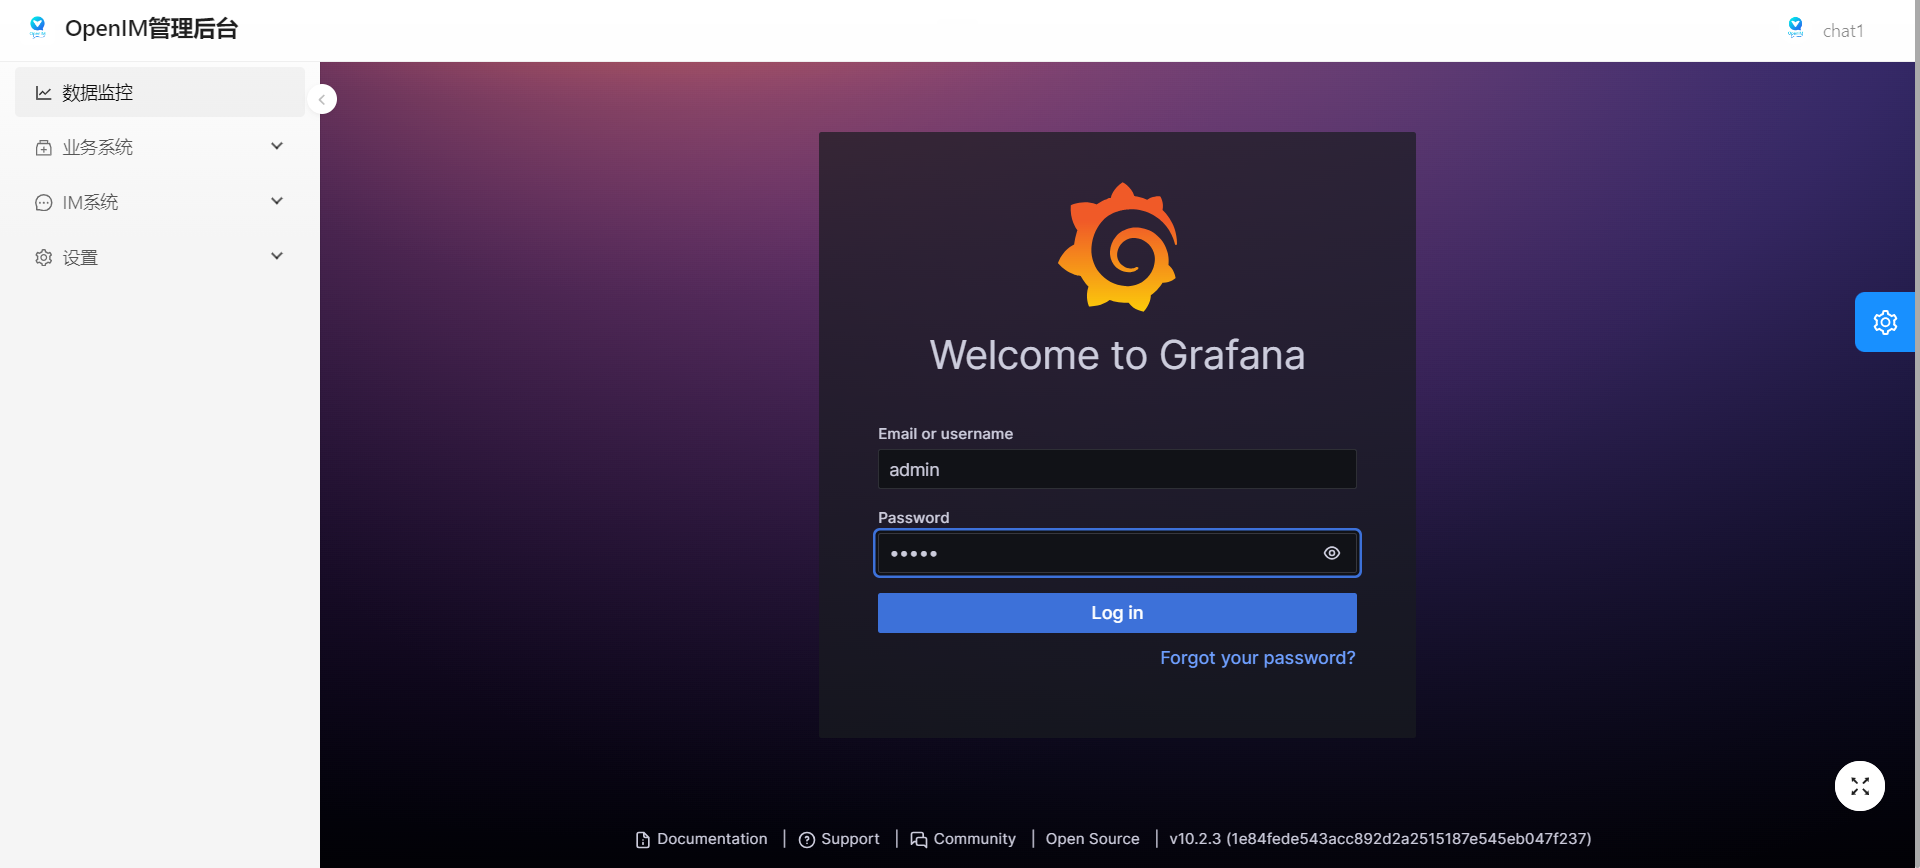
📌 3. Sign in to Grafana
First sign in to the admin console, then click the Data Monitoring menu on the left. Enter the default username (admin) and password (admin) to sign in to Grafana.
You can also access your_ip:13000 directly. Replace your_ip with the IP address of the deployment machine.
📌 4. Import the Main OpenIM Metrics into Grafana
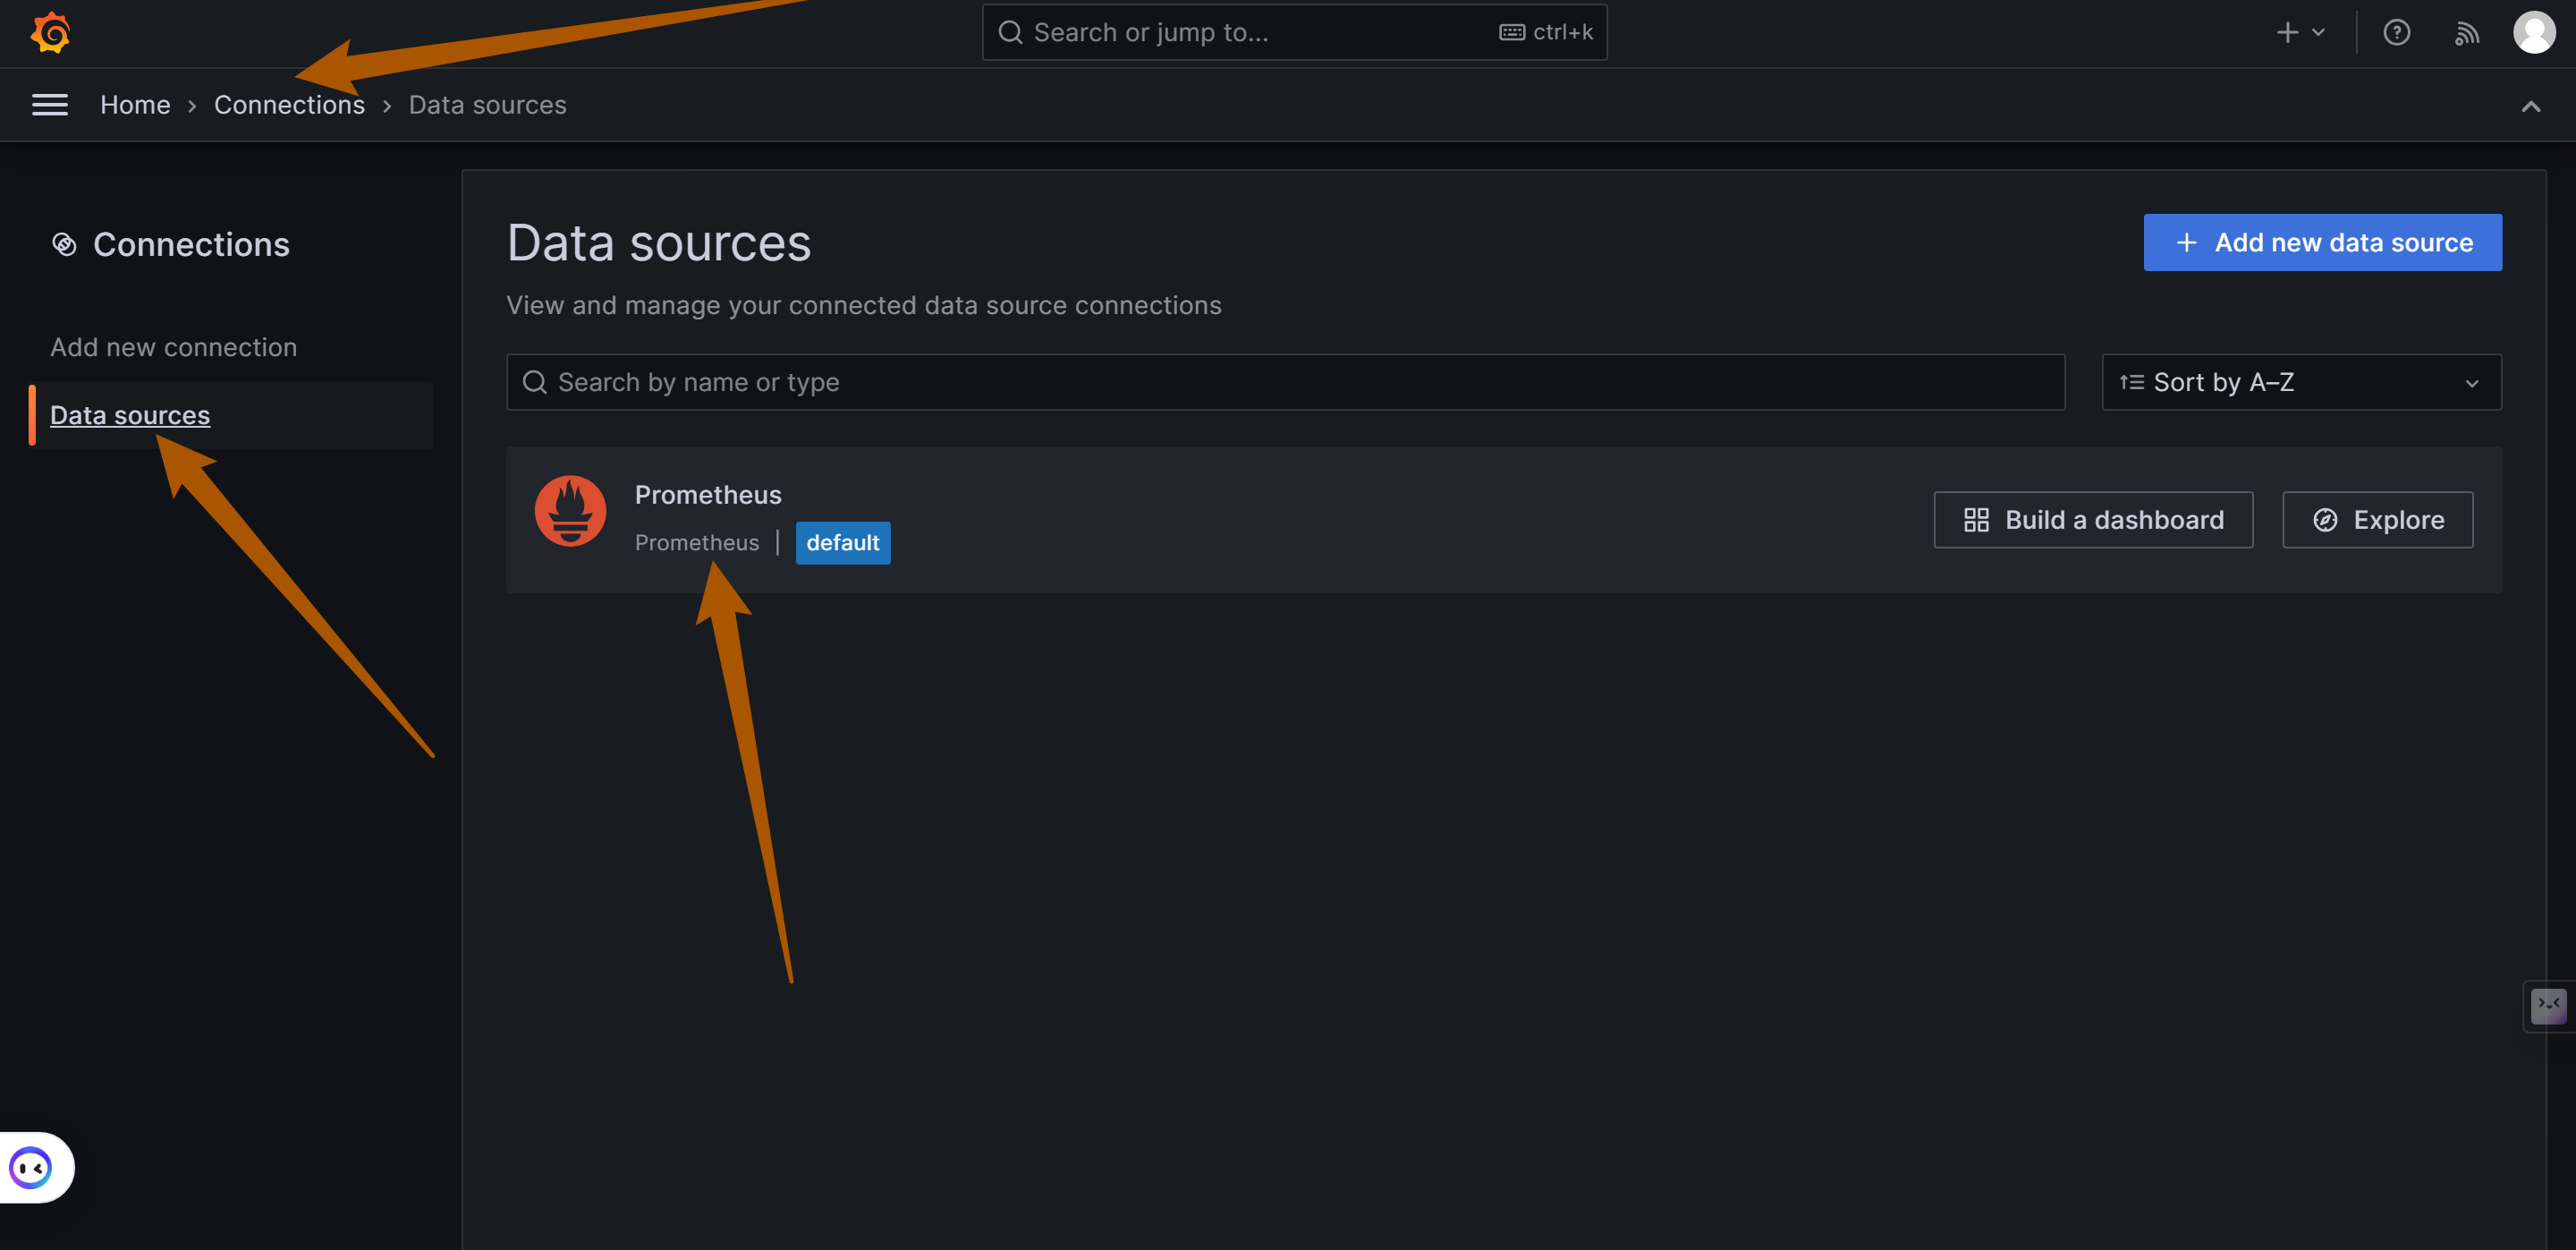
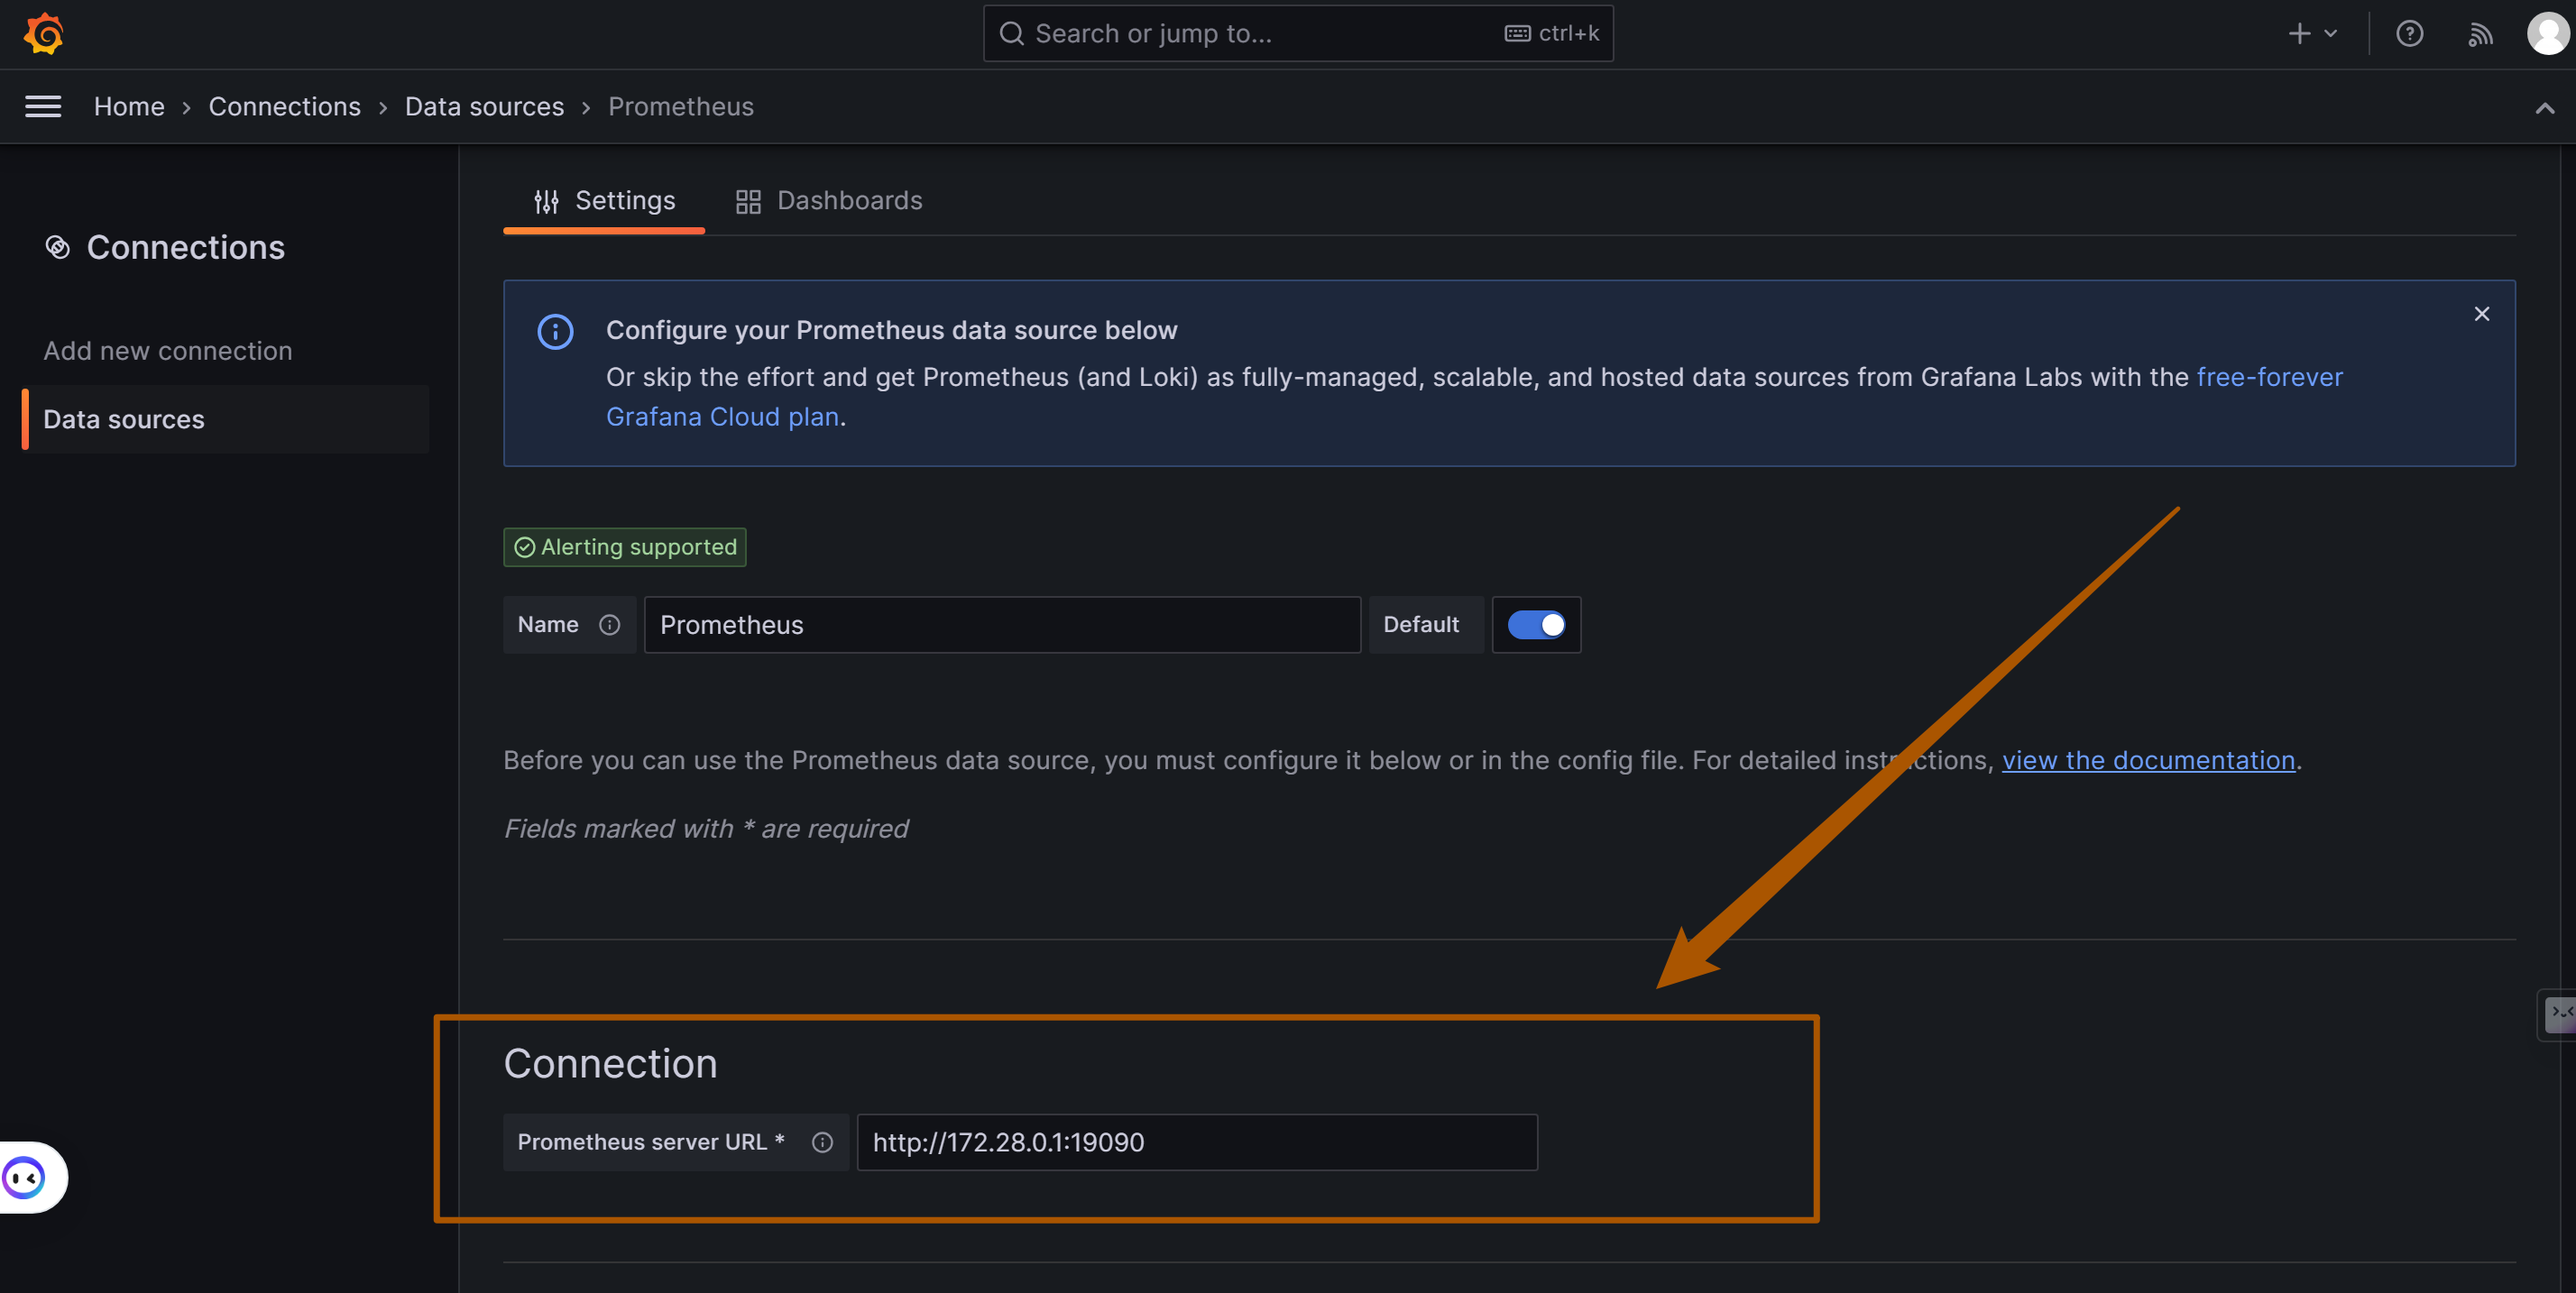
1. Add the Prometheus Data Source
As shown below, find Connections/Add new connection in the left navigation bar, enter prometheus in the input box to add the data source, and enter the Prometheus data source URL: http://your_ip:19090 (19090 is the default Prometheus port). Then click "Save and Test" to save it.
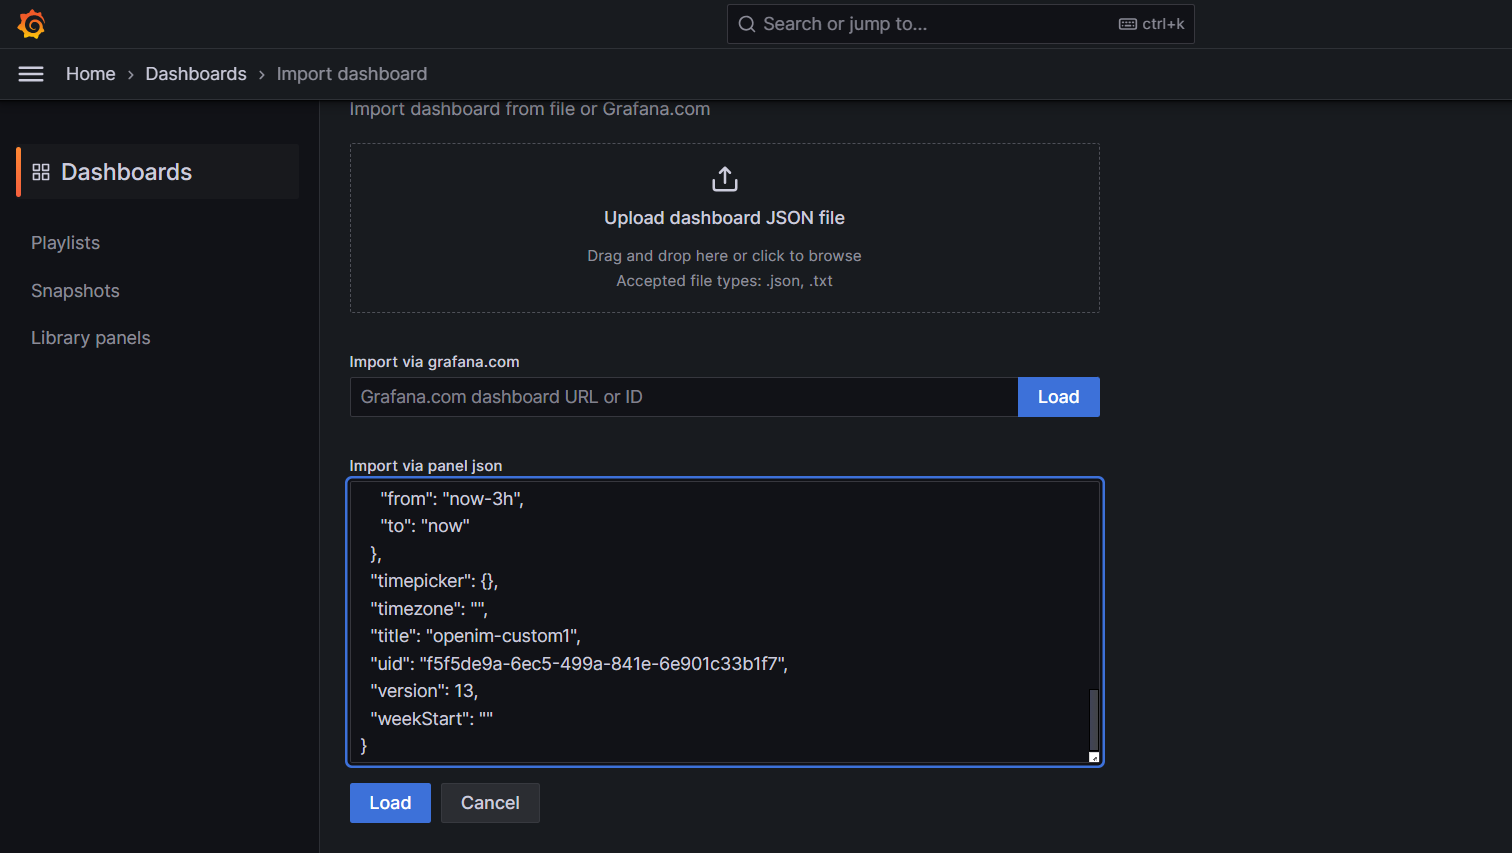
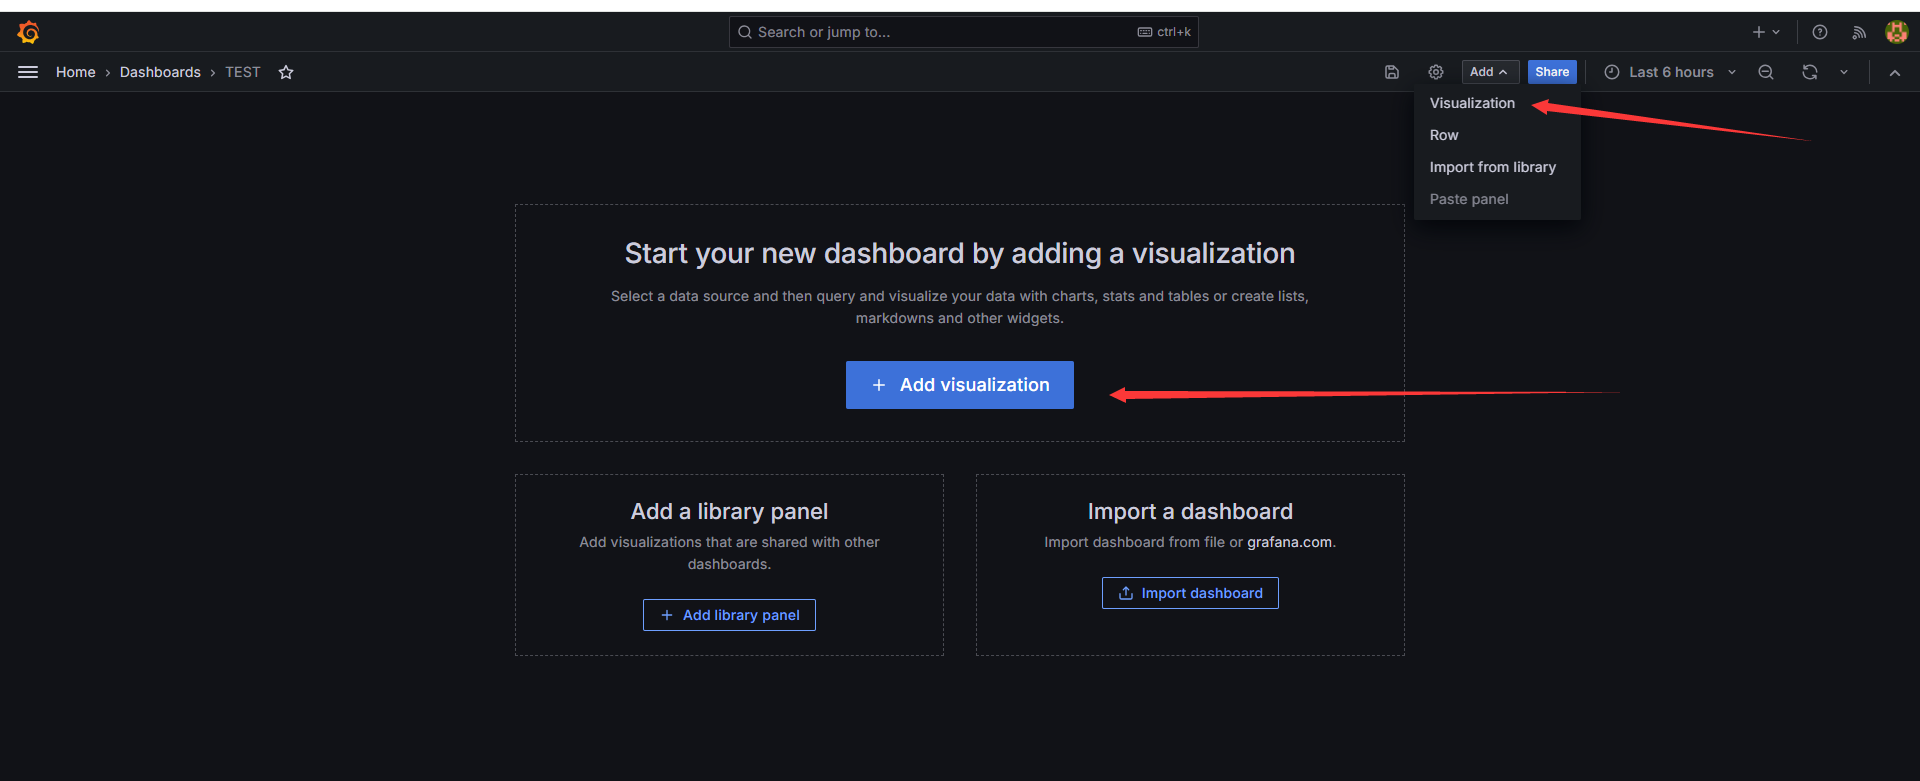
2. Import the Dashboard
In the left navigation bar, select Dashboards, click Create Dashboard, and then click Import dashboard to import the dashboard.
There are two ways to import the default OpenIM dashboard:
- Copy the content of
https://github.com/openimsdk/open-im-server/tree/main/config/grafana-template/Demo.jsoninto theImport via dashboard JSON modelarea. - Click
Upload dashboard JSON fileand upload theopen-im-server/config/grafana-template/Demo.jsonfile.
Then click the Load button.
Select the Data Source you just added, then click Import to import the metrics information, as shown below.
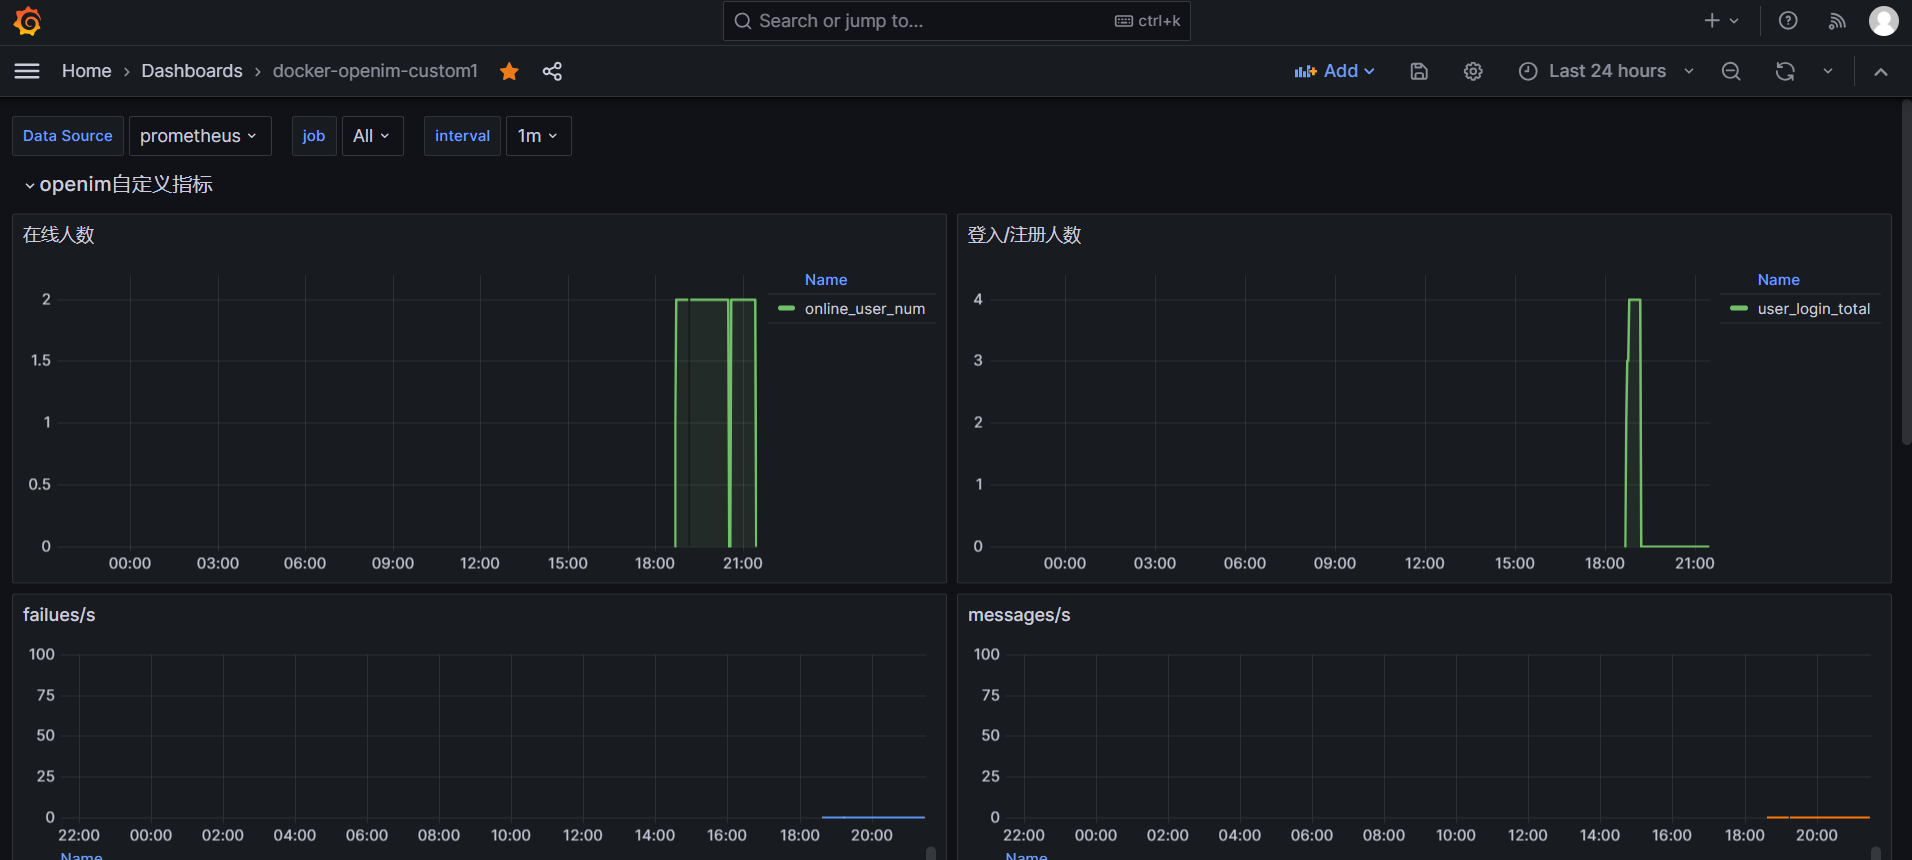
At this point, the main monitoring metrics for OpenIM are configured.
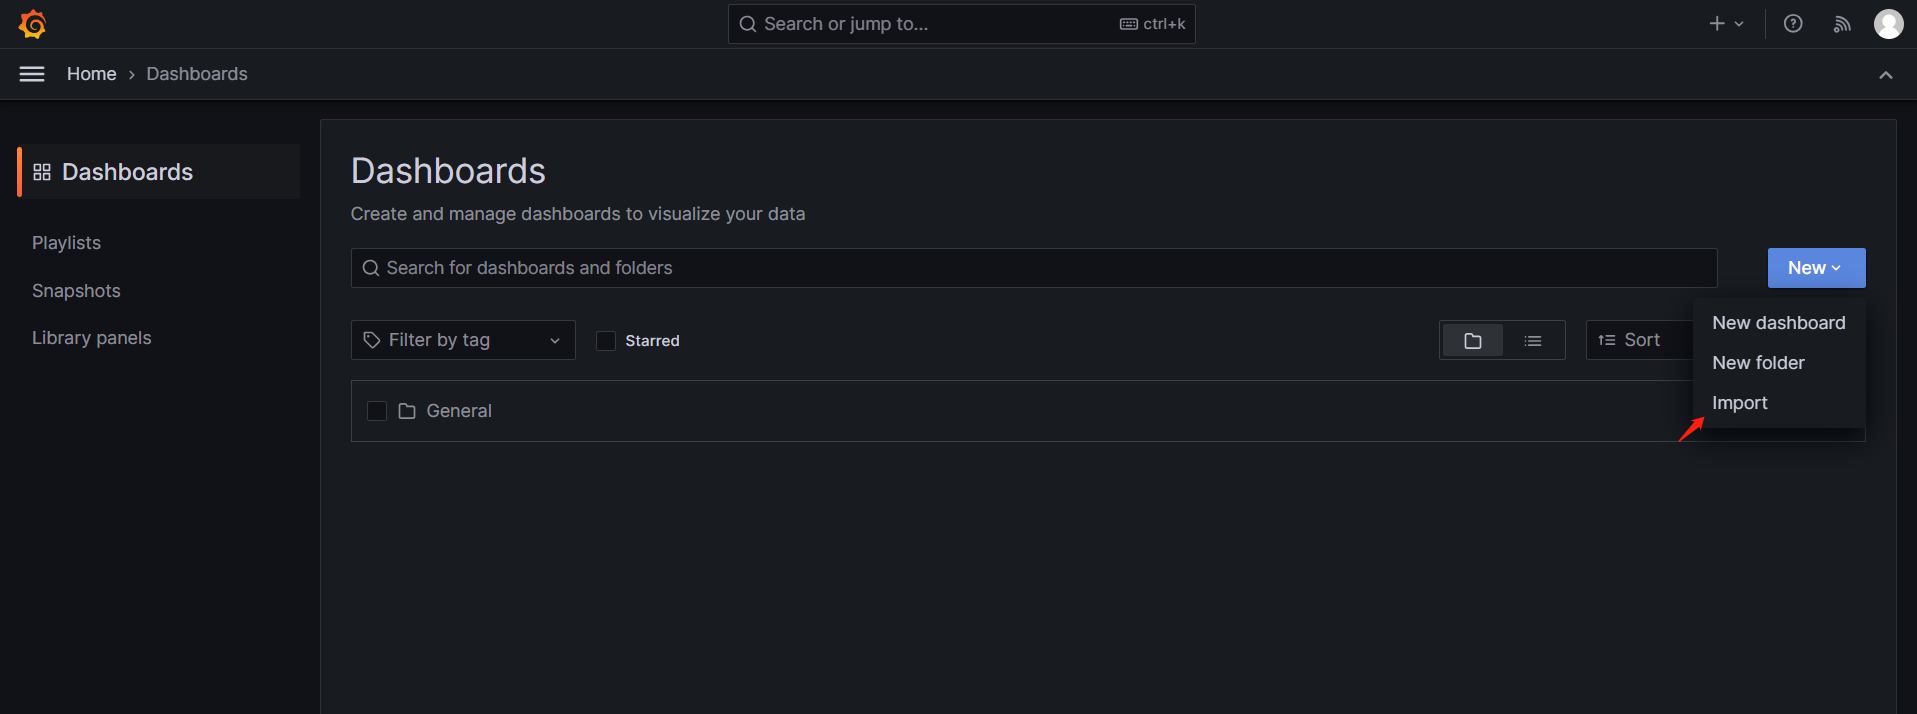
📌 5. Import node exporter Metrics into Grafana
Click Dashboards in the left navigation bar, then select Import from the New dropdown on the right.
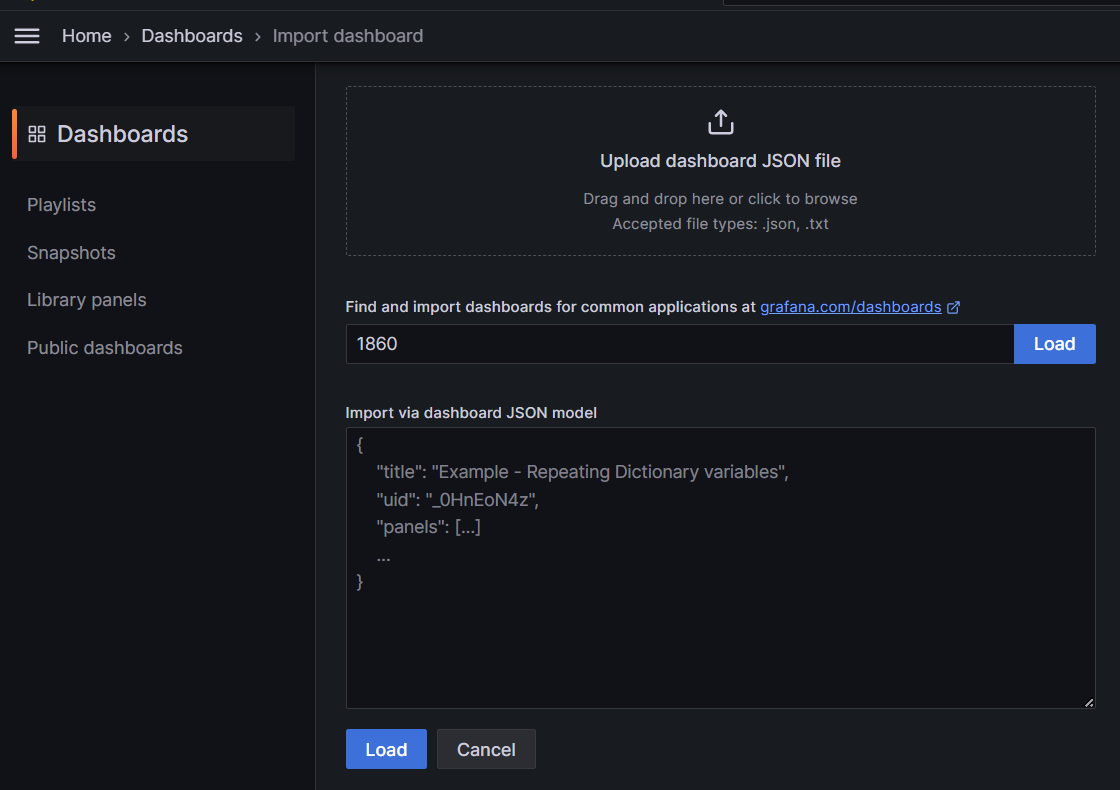
In the Grafana.com dashboard URL or ID input box, enter 1860, click Load on the right, and then click Import.
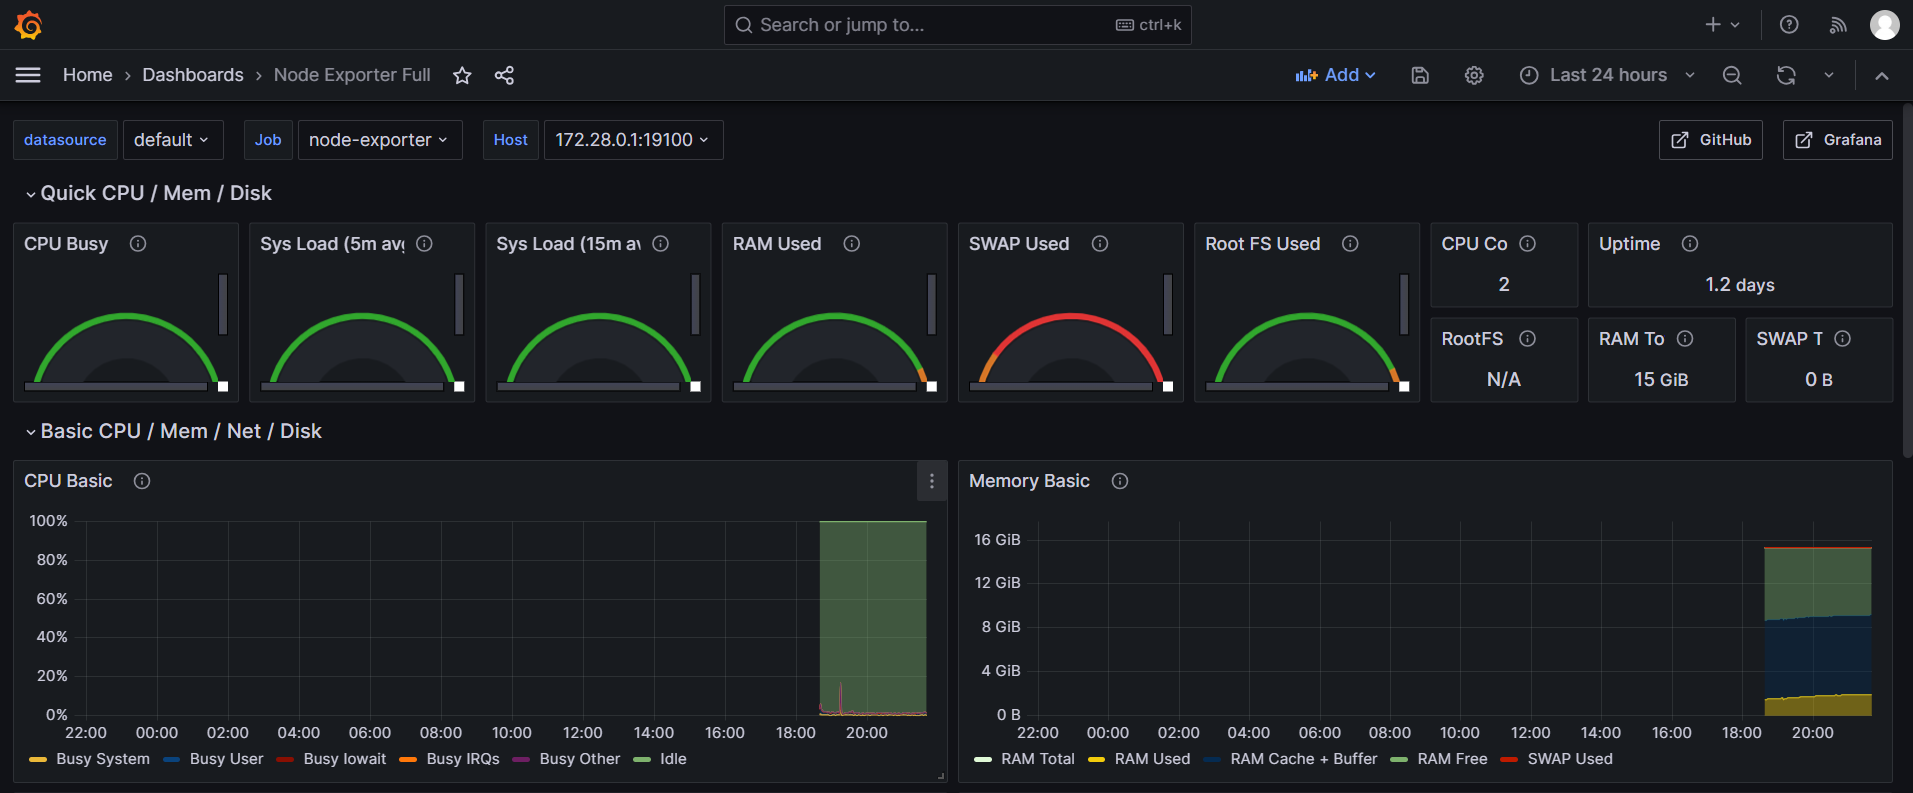
The node-exporter metrics are shown below.
📌 6. Component Overview
| Component | Description | Deployment |
|---|---|---|
| prometheus | Monitoring system component used to collect and store metrics data | Must be enabled manually |
| alertmanager | Component used to manage and send alerts | Must be enabled manually |
| grafana | Dashboard component used to display monitoring data | Must be enabled manually |
| node-exporter | Component used to collect node metrics such as server metrics | Must be enabled manually |